Data Visualization and Cartography for Social Scientists
About
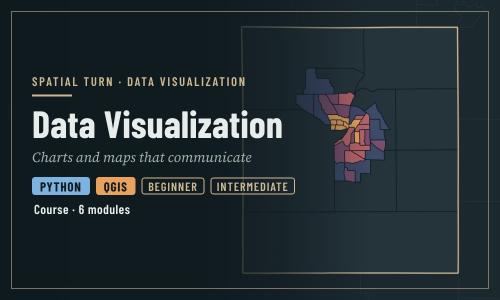
This course teaches how to turn data into clear, honest charts and maps. It is written for social scientists and other beginners, and combines design principles with hands-on practice in two free tools: Python in Jupyter notebooks and QGIS.
| Module | What you will learn | Tools |
|---|---|---|
| Introduction to Data Visualization | Why we visualize, how charts mislead, and design principles that apply to every figure | Python notebooks |
| Cartography Checklists | The questions to answer before making any map: audience, message, data, medium | Concepts |
| Fundamentals of Map Design | Map elements, color schemes, projections, thematic map types, normalization and classification | Concepts, Python and QGIS equivalents |
| Cartography in Python | Finished maps: layer order, labels with halos, basemaps, locator insets, scale bars, small multiples and export | Python notebooks |
| Cartography in QGIS | The same map with rule-based styling and labeling, a print layout with a locator inset, and export | QGIS |
| Accessibility in Map Design | Designing maps for people with color vision deficiency, testing palettes and writing alt text | QGIS and Python |
The modules are designed to be taken in order, but the concept modules (Cartography Checklists and Fundamentals of Map Design) can be read on their own.
Prerequisites
- A free CyberFaCES account to run the notebooks
- QGIS installed on your computer (see the Setup instructions below)
- New to QGIS? Work through the Foundations course's Getting Started with QGIS module first
- For the notebooks: basic Python, such as running cells and working with a
pandasDataFrame - No prior GIS or design experience is needed
All data used in this course is read directly from the web: the Introduction notebooks use datasets built into Plotly, and the Cartography modules and the QGIS challenge in the Accessibility module load small files from the Foundations and Case Studies courses. Learners never need to download data by hand.
This course is part of Enabling the Geospatial Turn in the Social Sciences, a set of training modules developed at Purdue University with support from the National Science Foundation.
| Type | Course |
|---|---|
| Level | Foundation |
| Length | 8 hours |
| Topics |
python QGIS Concepts Community: Spatial Turn |
Modules
-
Introduction to Data Visualization
Module 1 • 1 hour
Why we visualize, how charts mislead, and design principles that apply to every figure
-
Cartography Checklists
Module 2 • 1 hour
The questions to answer before making any map: audience, message, data, medium
-
Fundamentals of Map Design
Module 3 • 1 hour
Map elements, color schemes, projections, thematic map types, normalization and classification
-
Cartography in Python
Module 4 • 1 hour
Finished maps in Python: layer order, labels with halos, basemaps, locator insets, scale bars, small multiples and export
-
Cartography in QGIS
Module 5 • 1 hour
The same map in QGIS: rule-based styling and labeling, a print layout with a locator inset, and export
-
Accessibility in Map Design
Module 6 • 1 hour
Designing maps for people with color vision deficiency, testing palettes and writing alt text
Instructor

Aniket Dev Roy
Discussions
Please login to view discussions.